This is important!
For the first part, the plan can either reference the SOP if that is where policy is defined or the criteria for acceptability may be defined specific to the product in the Plan.
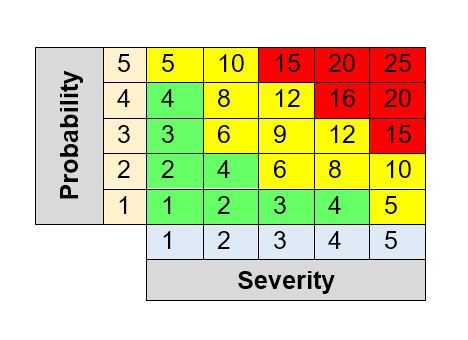
5×5 Matrix
Considering the 5×5 matrix, effectively, anything in yellow or green (risk score of 12 or below) is considered acceptable.

On the surface, that may seem odd to think that something so close to unacceptable is acceptable.
Acceptable or Unacceptable
Well, the line has to be drawn somewhere.
It’s either acceptable or unacceptable.
The second part, defining how to handle cases where the probability cannot be estimated is a bit awkward, seemingly stuck on to this with bubble-gum; however, it needs to be addressed!
Severity Drive the Mitigation
The most common approach is to state that a probability of 5 (i.e., the maximum if using the above scoring) is assigned and let the severity drive the mitigation considerations.
If there are ever any cases like this in any of the analyses, ample notations should be made to ensure the post-market reviews re-visit the risk to assess accuracy of the use of ‘5’ for probability.
Effectiveness
This shows the effectiveness of using both P1 (probability of occurrence) and P2 (probability that if it occurs, whether harm will result) values.
P1 can be 5 (maximum) but P2 need not be and may help better characterize the risk.
Oh, and realize that if you have software, IEC 62304 says you should always consider the likelihood of software failure to be 100% (i.e., 5 using the above scoring).
Here, especially, is where that P2 value shines.